

Platform Observability Architecture
The visibility layer of the JLT-Lane platform — where system signals are exposed, collected, and turned into operational understanding.
Why this page exists
Observability is how the platform explains its own behavior. This page documents the path from service-level metrics to dashboards and operational visibility inside the JLT-Lane sandbox environment.
In the broader Engineering Mesh, observability sits between sandbox experimentation and runbook-driven operations. It is the layer that turns system behavior into actionable signals.
Observability model
Click the diagram to open full-size.
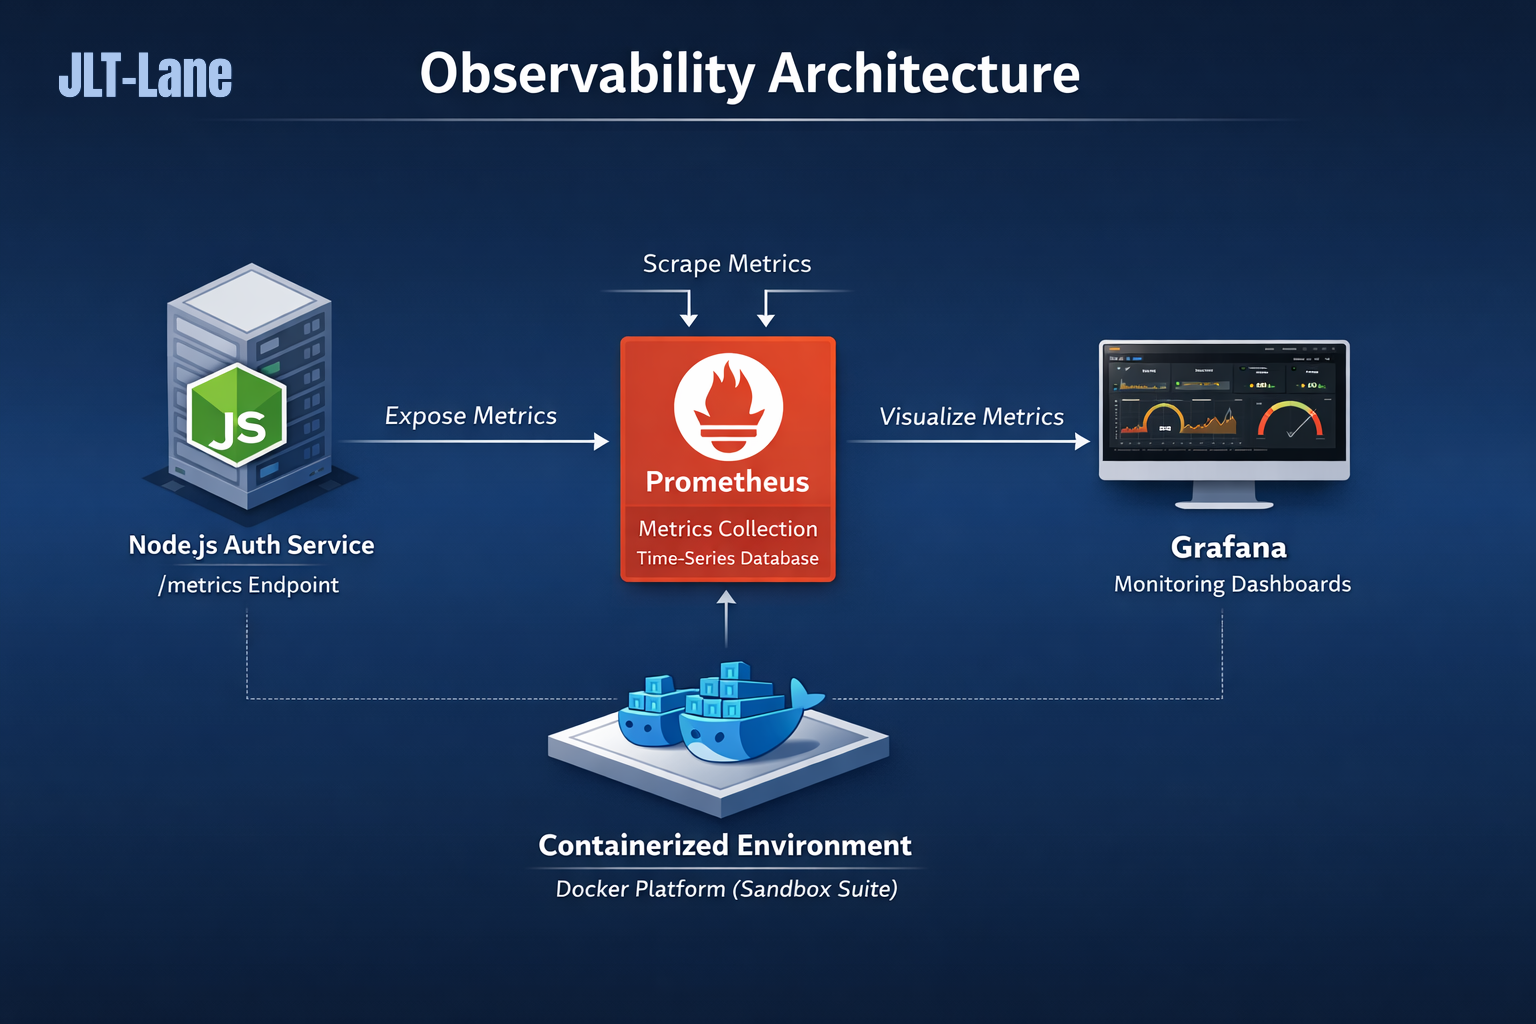
Signal flow
Node.js Auth Service
        ↓
/metrics endpoint
        ↓
Prometheus scrape job
        ↓
Prometheus time-series database
        ↓
Grafana monitoring dashboards
Core components
Node.js Auth Service
The service exposes Prometheus-compatible metrics describing runtime behavior, request activity, and resource pressure. This is the first point where the platform becomes visible from the inside.
process_cpu_seconds_total
process_resident_memory_bytes
nodejs_active_handles
auth_service_http_requests_total
Prometheus
Prometheus scrapes the metrics endpoint at regular intervals and stores the results as queryable time-series data. It forms the measurement layer of the observability stack.
scrape_configs:
  - job_name: "auth-service"
    metrics_path: /metrics
    static_configs:
      - targets: ["auth-service:3002"]
Grafana
Grafana turns collected metrics into visual dashboards for service health, throughput, CPU, memory, and runtime pressure. This is where raw metrics become human-readable platform insight.
Example PromQL queries
rate(auth_service_http_requests_total[5m])
rate(process_cpu_seconds_total[1m])
process_resident_memory_bytes
nodejs_active_handles
Why observability matters
Modern systems should not only run — they should be able to describe their own condition. Observability helps teams detect issues earlier, troubleshoot with more precision, and operate services with confidence.
At JLT-Lane, observability is treated as a built-in platform layer rather than an afterthought. It supports both technical reliability and operational clarity.
Where this sits in the Engineering Mesh
In the JLT-Lane Engineering Mesh, observability is the bridge between experimentation and action.
Architecture
        ↓
Sandbox
        ↓
Observability
        ↓
Runbooks
        ↓
Delivery
The sandbox creates a safe place to generate signals. Observability captures them. Runbooks turn them into decisions and repeatable response paths.
From observability to action
These pages take the signals shown here and connect them to the rest of the platform.
Step back into the broader platform map: Engineering Mesh, sandbox, reliability flow, and system structure.
Move into runbooks →See how observability signals are translated into operational response, debugging steps, and recovery procedures.
Use the toolkit →Explore the supporting scripts, patterns, and tooling references that help make observability usable in practice.
Return to MeshHub →Go back to the documentation control plane to choose another path through the platform.
Read the blog ↗Follow longer reflections on observability, platform engineering, and system design.